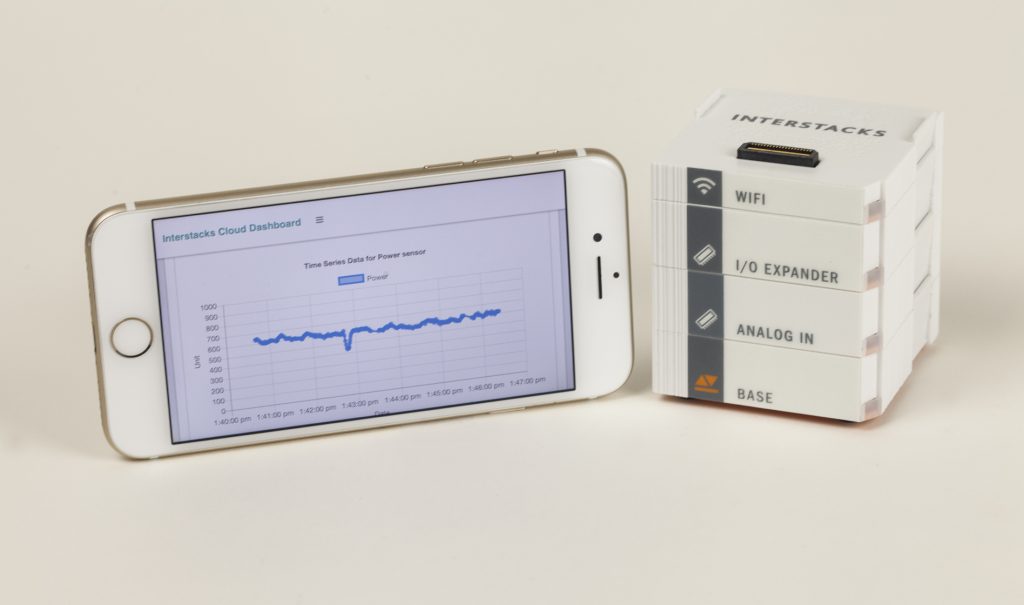
View machine and sensor data on the Interstacks MyStacks customizable visualization dashboard via any web browser on any device – phone, tablet, or laptop. Get alerts via email and text messages based on criteria you select. See real-time OEE, up/down time, and parts count data.

Contact Us Now

Use Interstacks cloud device management to see the status of all of your connected stacks and remotely deploy stack blueprint (software) updates “over the air” (OTA updates).

Secure and encrypted – All data is encrypted in transit and at rest in the database. Network firewalls only need to allow access to one URL. Secure MFA and SSO logins supported.

Stacks can also send information directly to any third-party I IoT cloud platform or on premise server using REST APIs, Modbus TCP, or Modbus RTU.

(Full MyStacks documentation is in the Support section of this web site: MyStacks Documentation)

You must login to your Interstacks account to view connected stacks.

MyStacks Account Login    Contact Us
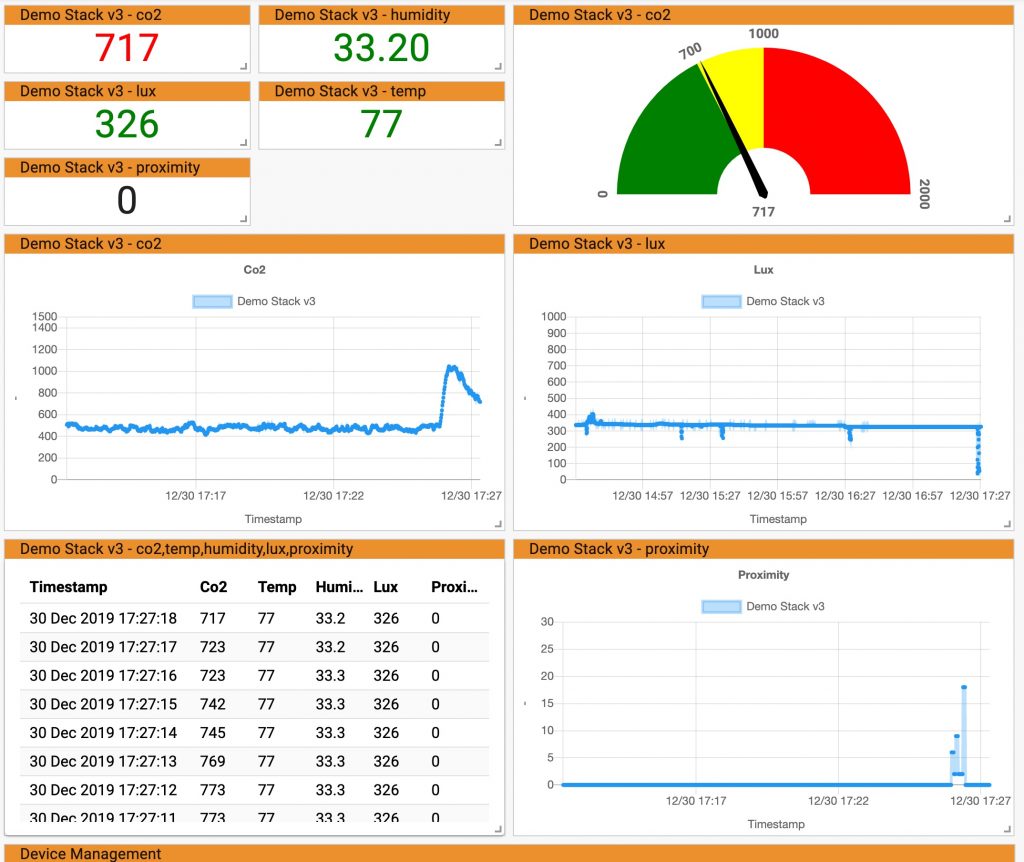


View data sent from a stack in any web browser on any device anywhere.

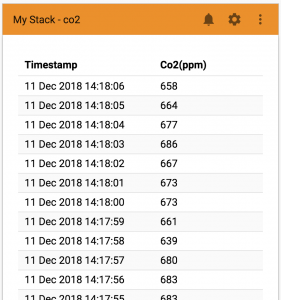
All data sent to the MyStacks cloud dashboard is timestamped and saved in a database for viewing immediately, generating reports, and exporting to CSV files for importing to spreadsheets.

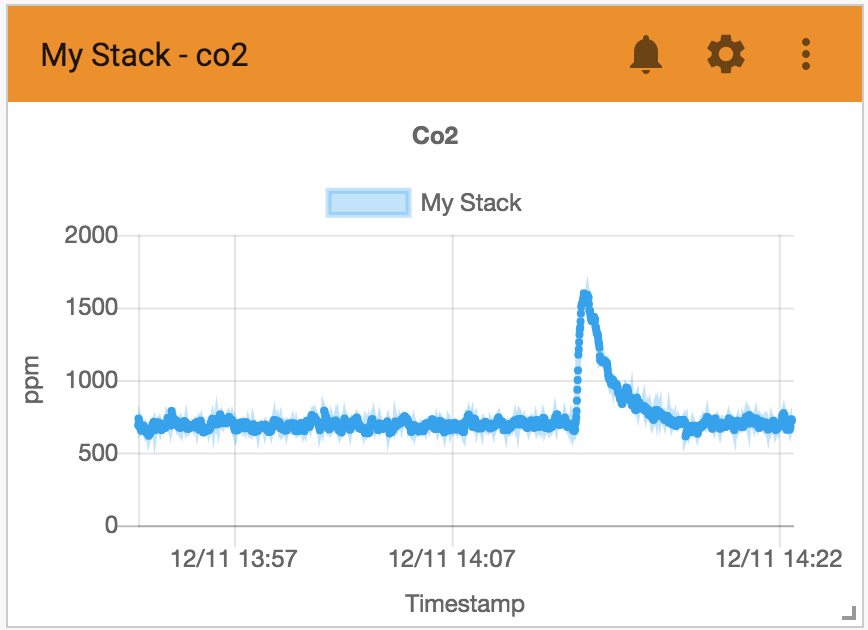
Select from a menu of visualization widgets (for example, single value, line charts, tables).

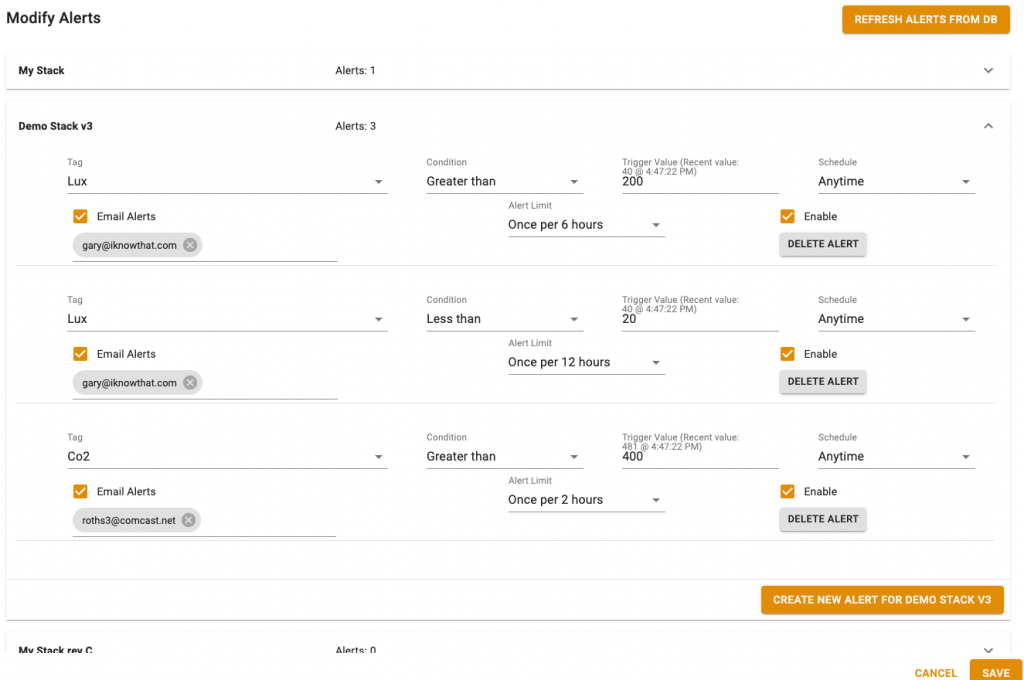
Text and email alerts can be sent based on criteria you select, for example a sensor exceeding some threshold value.

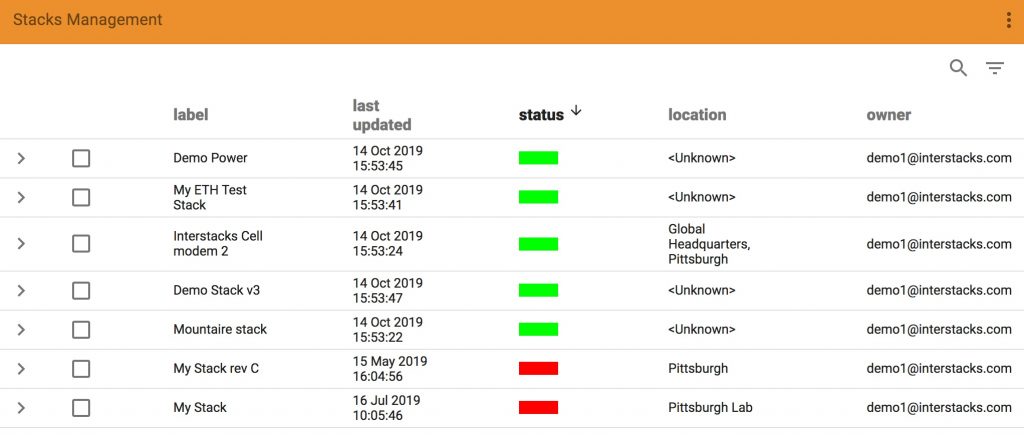
Stacks management

View the connection status of all of your stacks in one list. Manage over-the-air (OTA) software updates.

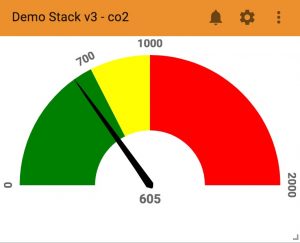
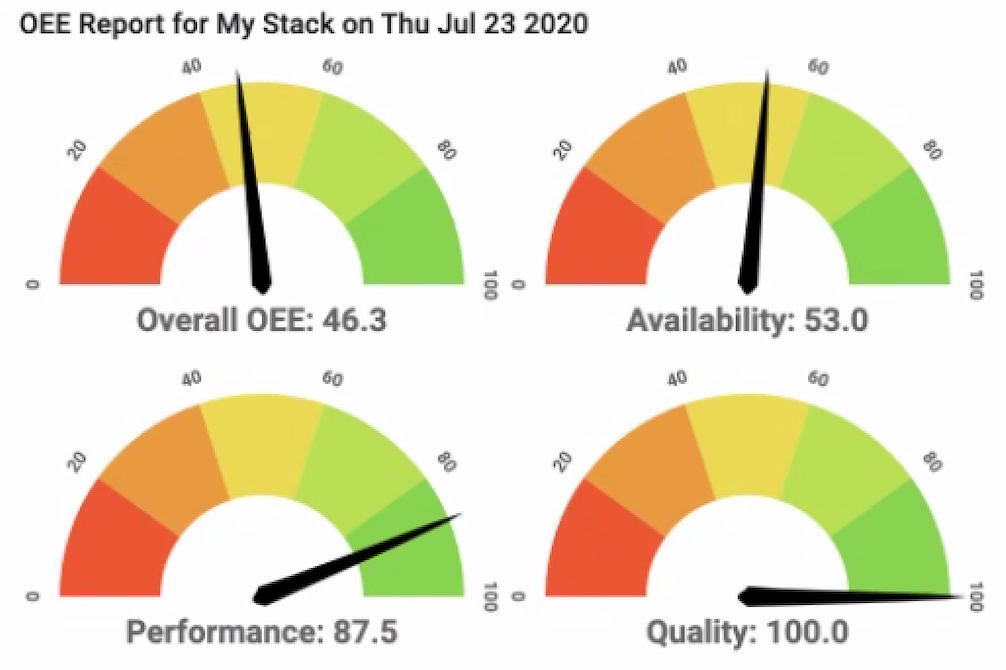
Set red, yellow, green indicator levels on visualization widgets.

Gauge

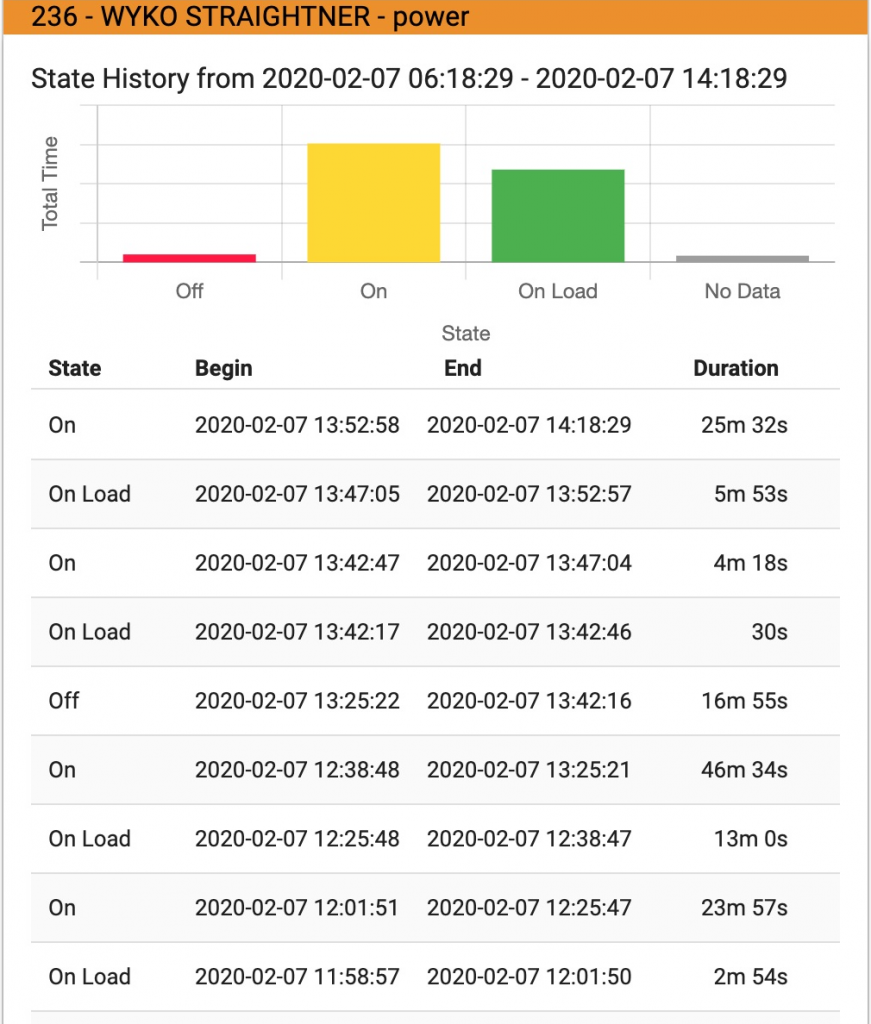
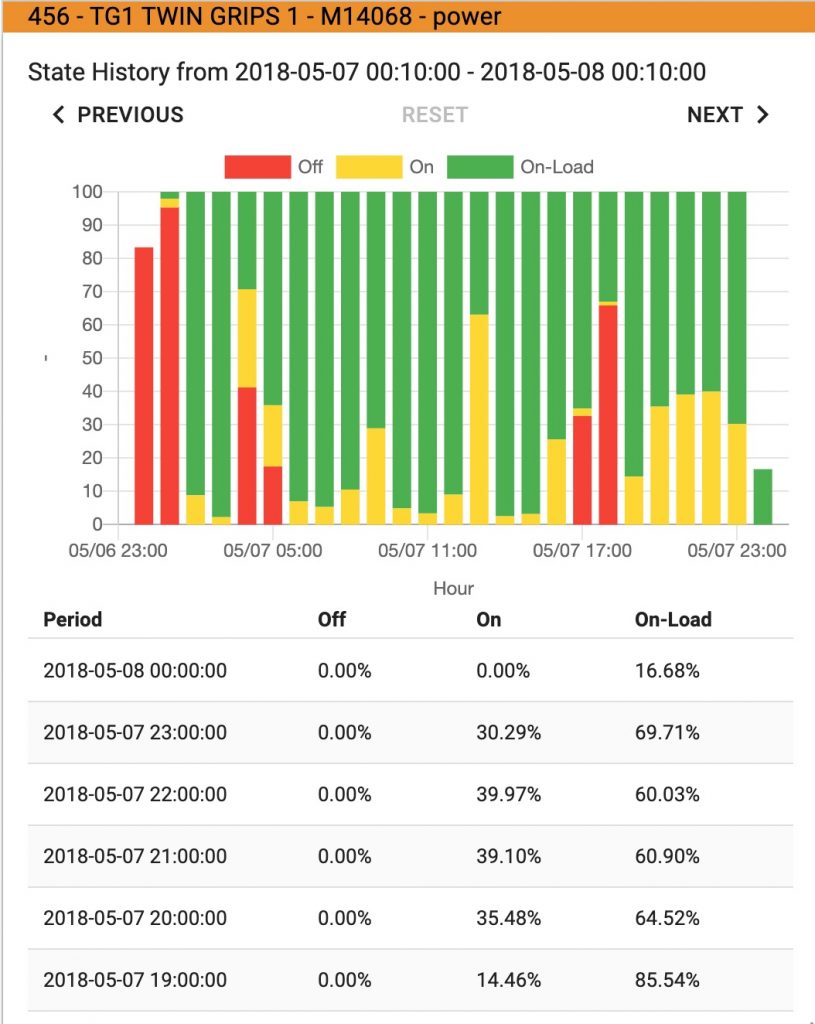
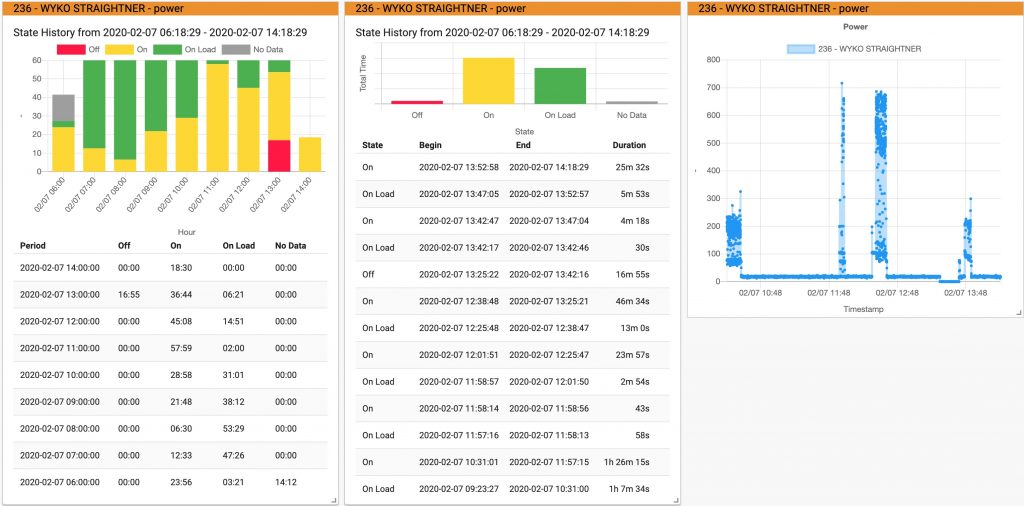
Analytics – View machine on, off, and on-load times for productivity and OEE monitoring.

Notes – Add team collaboration notes to dashboards to log maintenance and operations events.

Analytics – Bar chart showing 24 hours of machine utilization (OEE): Off, On, and On-Load.

See productivity by machine, by shift

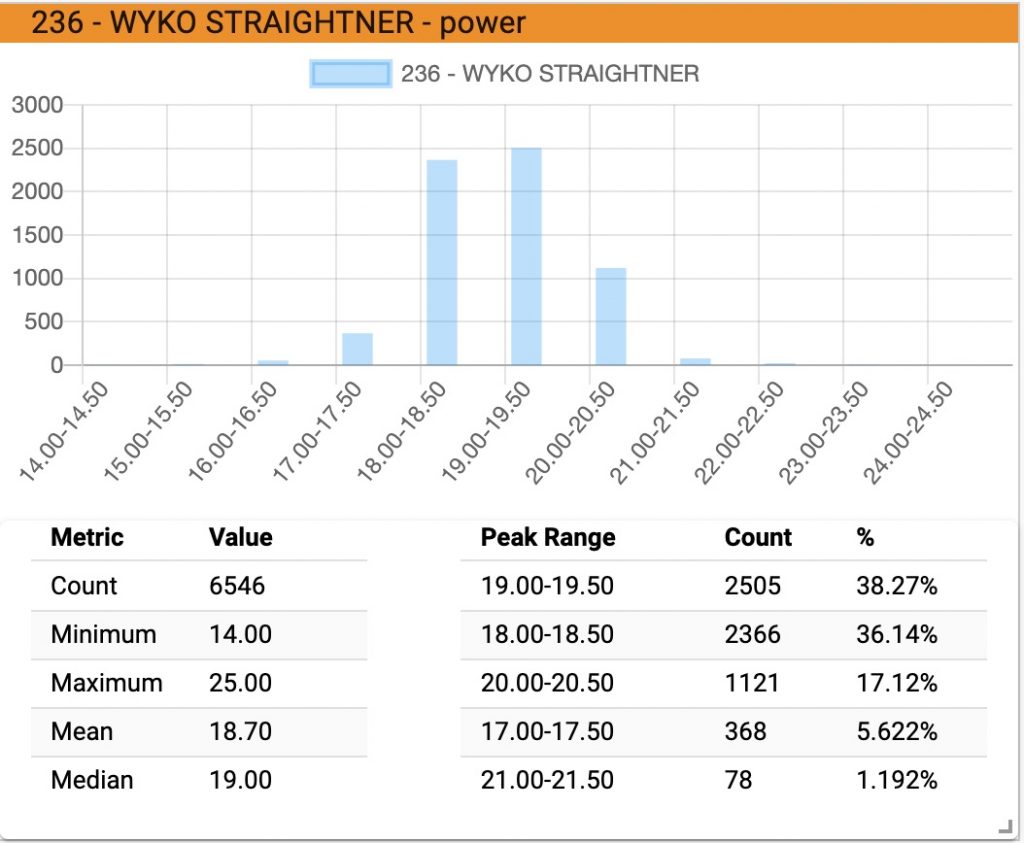
Analytics – Machine utilization (OEE) analysis based on raw sensor data. Use power consumption sensors or switch closures to record utilization, cycle counts and cycle times per hour, per shift, and per day.

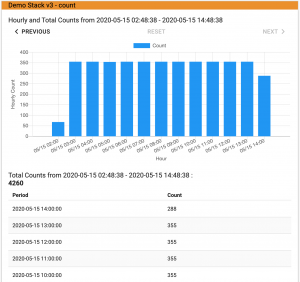
View counts history for machine cycles (open/close, cut) parts entering a machine, packaging line pieces, and flow meters.

Advanced OEE reports

OEE gauges

interstacks

Secure and encrypted

All data is encrypted in transit and at rest in the database. Network firewalls only need to allow access to one URL. Secure MFA and SSO logins supported. Hosted in the most secure data centers in the world with frequent penetration testing.