Interstacks helps you monitor machines and sensors so you can increase productivity, reduce maintenance costs, or add remote monitoring features to your OEM industrial equipment. It does this by using snap-together, modular electronic blocks – Stacks, and an integrated IoT cloud platform – MyStacks IoT cloud. One result of our ongoing investment in product development is that our MyStacks IoT cloud platform is always getting new features based on customer input.
In this blog post, we will summarize some of the more recent additions to the MyStacks platform.
Multi-Tag Report Widget
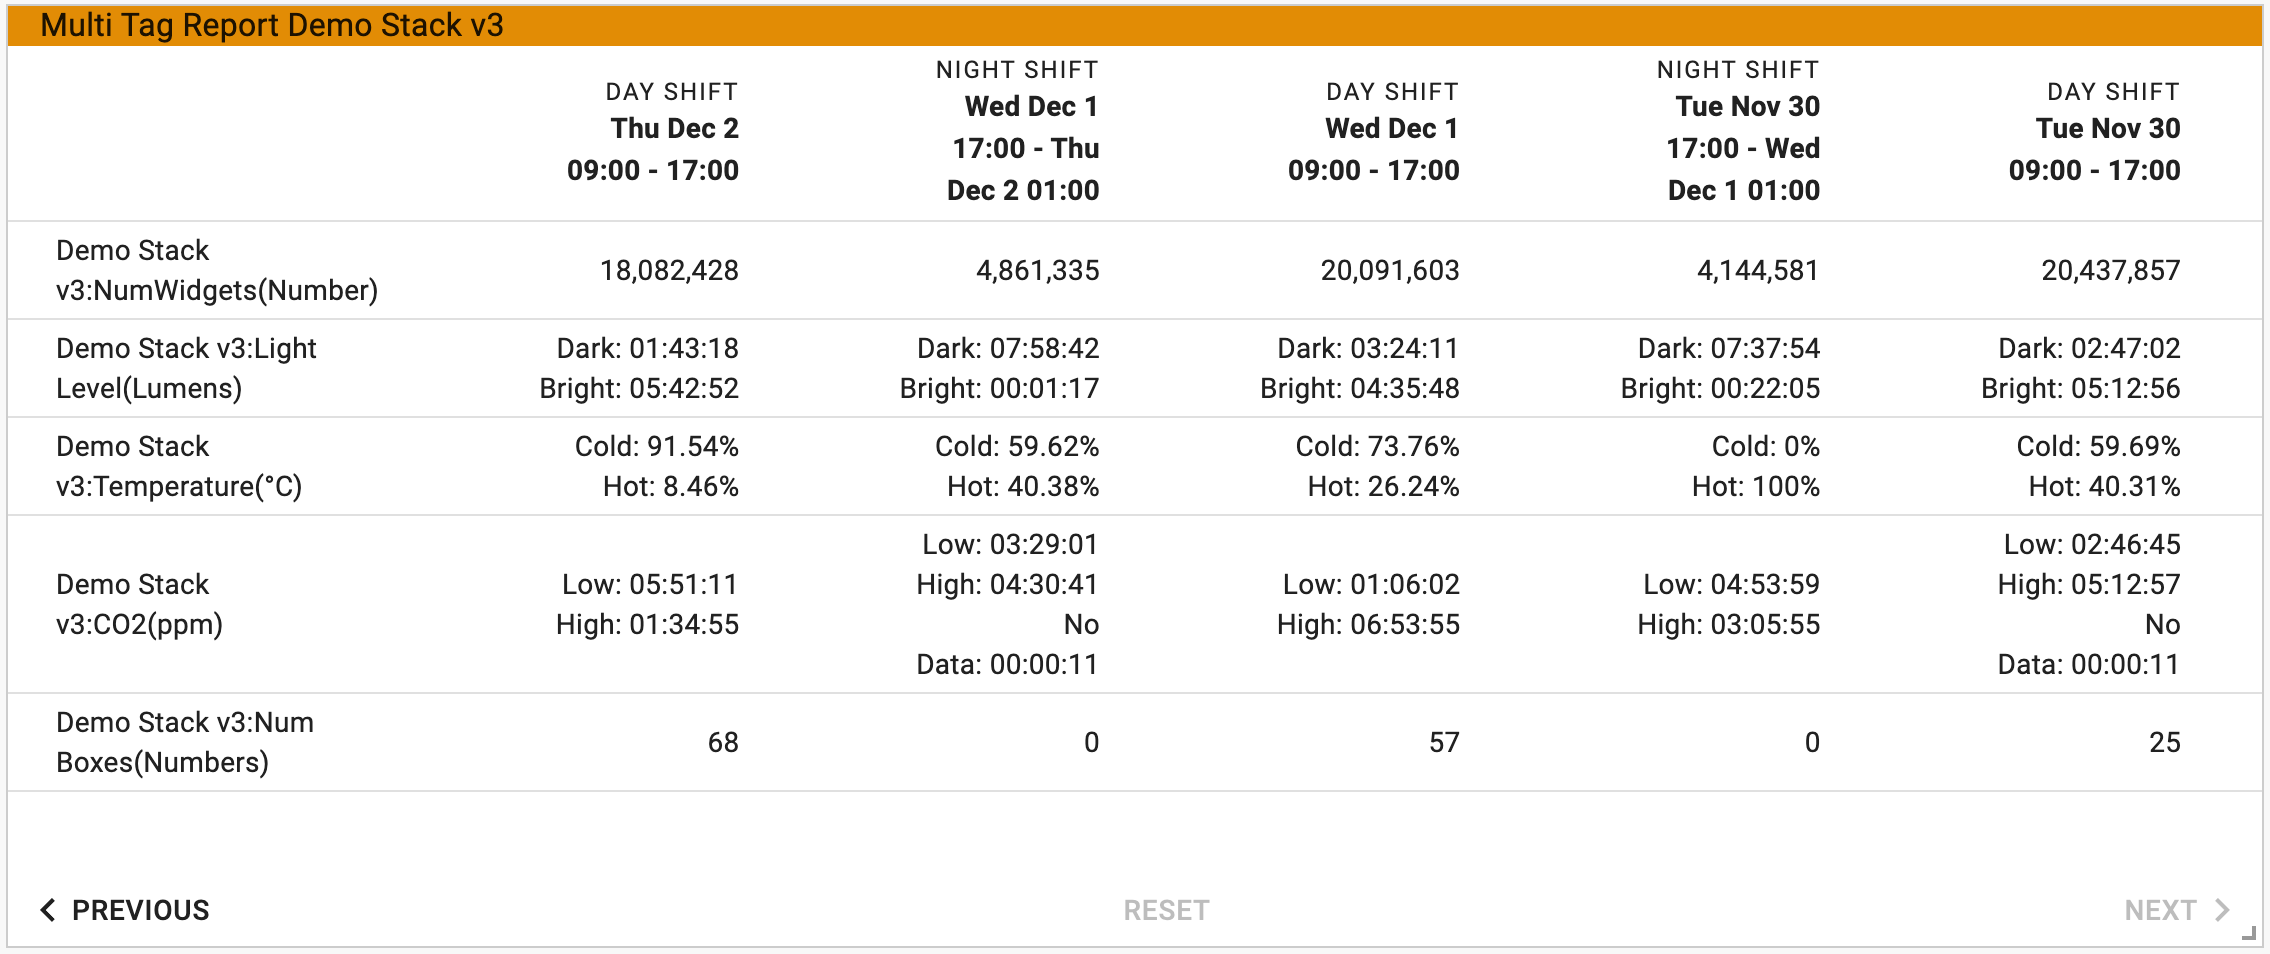
One of the new widgets you can add to your dashboard is the Multi-tag report widget. When you have multiple sensor or data feeds from one or many stacks, you can use this widget to view count or state information from all of them. A table/spreadsheet view has a list of tags and user defined time periods. These time periods could be hours, days, or user defined shift periods. Each cell in the grid is an aggregate of time in each state, percent of time in each state, or an aggregate of counts (open/close digital count). Of course the most recent column is updated in real-time as data is received.
If you wanted to monitor the productivity of many machines in your factory, you could use the Multi-tag report to see counts of units for each machine by shift.
Sharing Dashboards
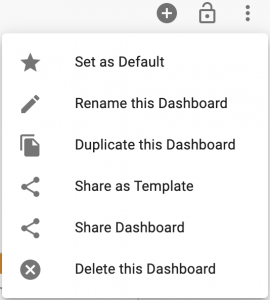
Many customers have large teams that work together to monitor their operations. A number of dashboard sharing features have been added to support those workflows. After you have multiple dashboards, you may want to rename, delete, or make one your default. To do this, select the three vertical dots icon in the top right of the scrollable page area. You will then see a pulldown list with those choices. You can duplicate the current dashboard by selecting “Duplicate this Dashboard”.
If you want to share your dashboard with all the users in your group, select “Share Dashboard”. From the pop up, select the group to share this dashboard. Click on “Share”. Now this dashboard can be accessed by anyone in that group based on the privileges (admin, read only, write) they have been assigned for that group.
The shared dashboard will automatically show up in the dashboard list of all of the users in the group when they next log in. Multi-user sharing is achieved through locking and unlocking a shared dashboard. Shared dashboards always open in the locked state. If a user chooses to modify the dashboard (and they have write access), they can click on the lock icon in the top right to unlock it.
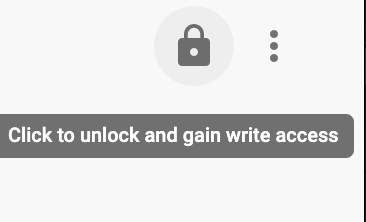
The unlock will be successful if no one else has exclusive access to the dashboard already. When unlocked, the current user has exclusive access to modify the dashboard until they lock the icon once again.
If you have a large number of dashboards, you may want to manage them by creating groups of dashboards. To create a dashboard group, simply name (or rename) dashboards using a prefix name for the group followed by a period character, then the specific name of that dashboard. For example, if you name dashboards “MyGroup1.machine1”, “MyGroup1.machine2”, “MyGroup1.machine3”, when you go to the dashboard selector, you will see a single entry called “MyGroup1”. If you select the arrow icon for that group, you will expand (or contract) the list of dashboards in that group. To go to a specific dashboard in the group, simply select it.
Tag properties
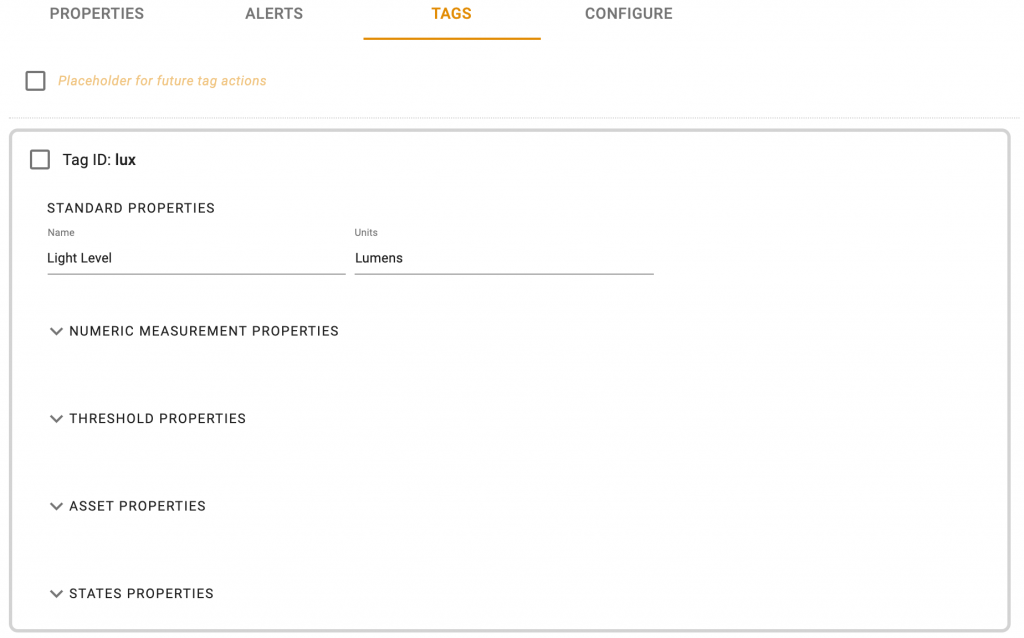
Various configuration settings for tags now default to being centralized in the tags tab section of the Stack Management info popup rather than distributed in visualization widgets. You can get to the centralized tag properties popup via direct links from visualization widget configuration panels or from the blue Info icon in the Stack Management widget.
The centralized tag properties will be reflected in all visualization widgets that have the “Use tag settings” checkbox checked. The tag name can be changed as well as the units label used in visualizations. Each section of the tag properties can be expanded or collapsed using the arrow icon. Numeric measurement properties can optionally include a scaling factor and a fixed offset. Threshold properties configure the Gauge, Line chart, and Tank level dividing lines (to represent nominal, above nominal zone1, zone2, zone3). Asset properties allow you to assign internal asset numbers to a tag. State properties define the mapping from raw data to “states”. For example, below 80 could be the state “cold” and above 80 could be the state “hot”. These states are used in various visualization and reporting widgets.
Alerts
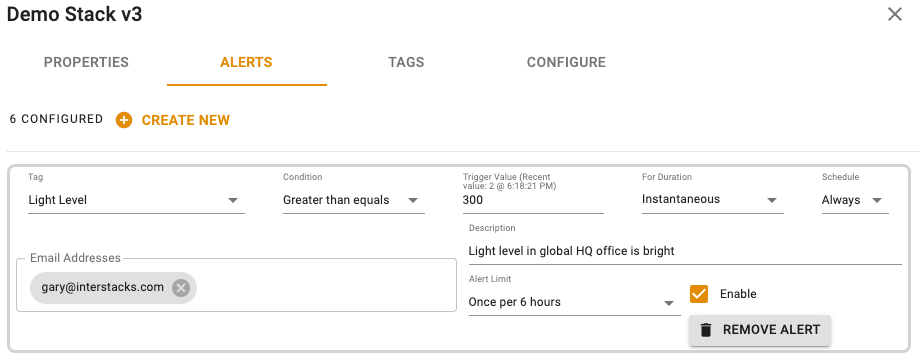
A number of additions have been made to criteria used to trigger email or text alerts. More sophisticated alert logic can now be used. For example, requiring a trigger condition to be met for a sustained period of time.
State history and state table widgets
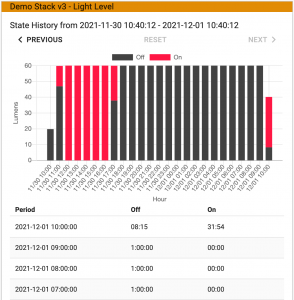
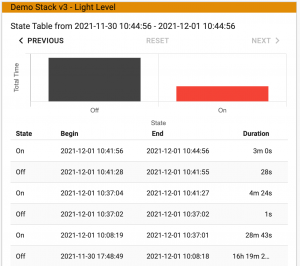
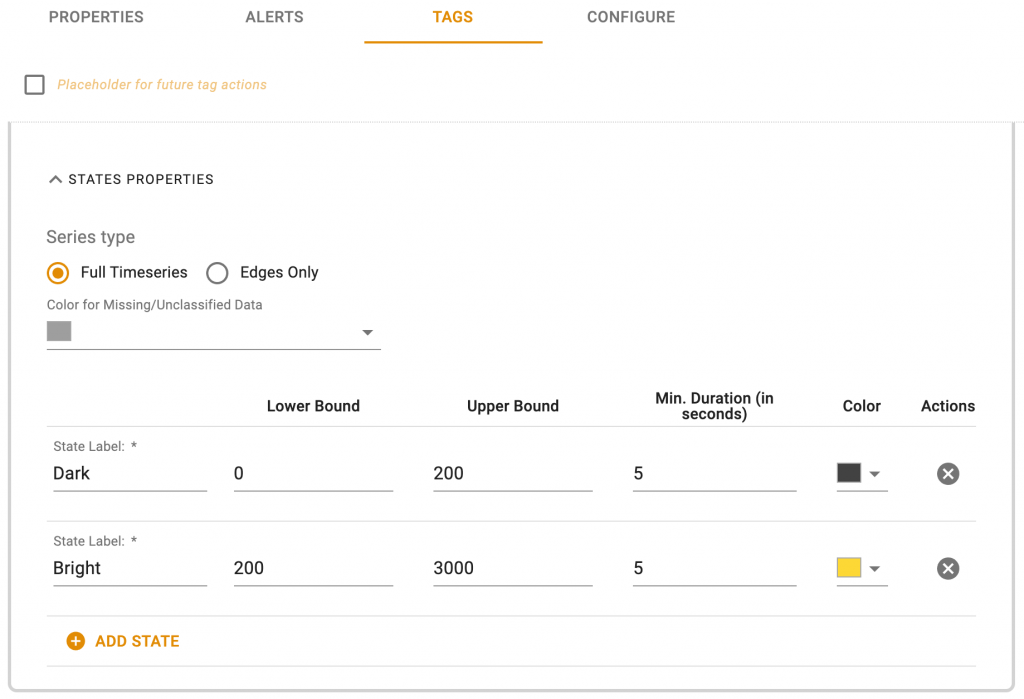
More extensive state management capabilities have been added. State properties define the mapping from raw data to “states”. For example, below 80 could be the state “cold” and above 80 could be the state “hot”. Or below 20 Amps could be “Machine Off” and above 20 Amps “Machine On”. You may define as many states as you need. You can also set a minimum time period required to enter a defined state. These states are used in the State history, State table, and Multi-tag report widgets.
The “State Table” widget will show a timestamped list of all defined states for a single data stream (tag). When you configure the widget, you define state trigger levels for the data stream and each state’s name. The list shows start, end, and duration times.
The “State History” widget shows a bar chart indicating the percentage of time or total time the time series data (tag) spent in each state during each hour and a text table summary below the chart.
Contact us
The support section of the web site includes more comprehensive information on using our MyStacks IoT cloud platform.
As always, please contact your Interstacks project support engineer or email info@interstacks.com with your questions and feedback.
